Plot CV parameter pair correlations
Source:R/plot_cv_pair_correlation.R
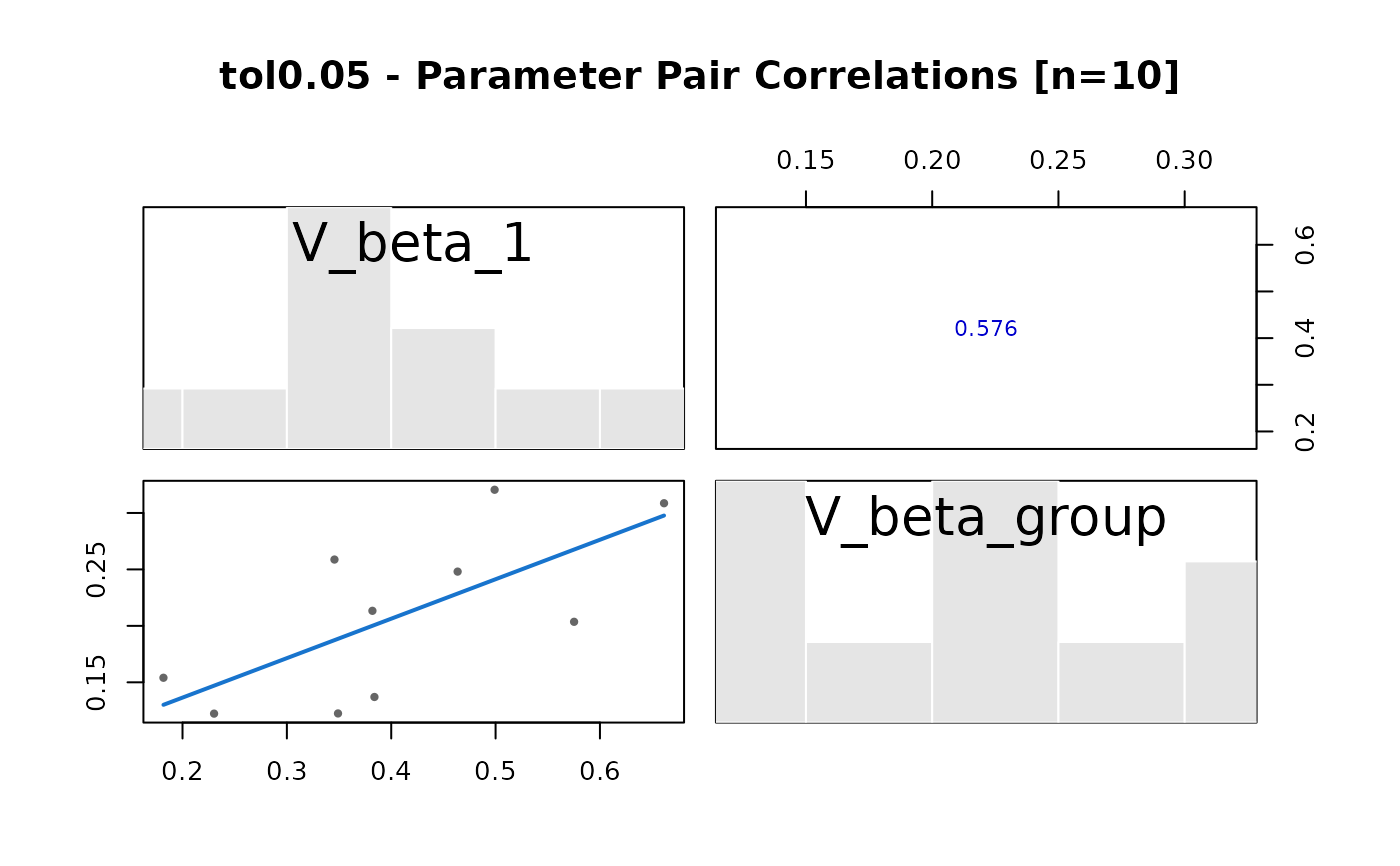
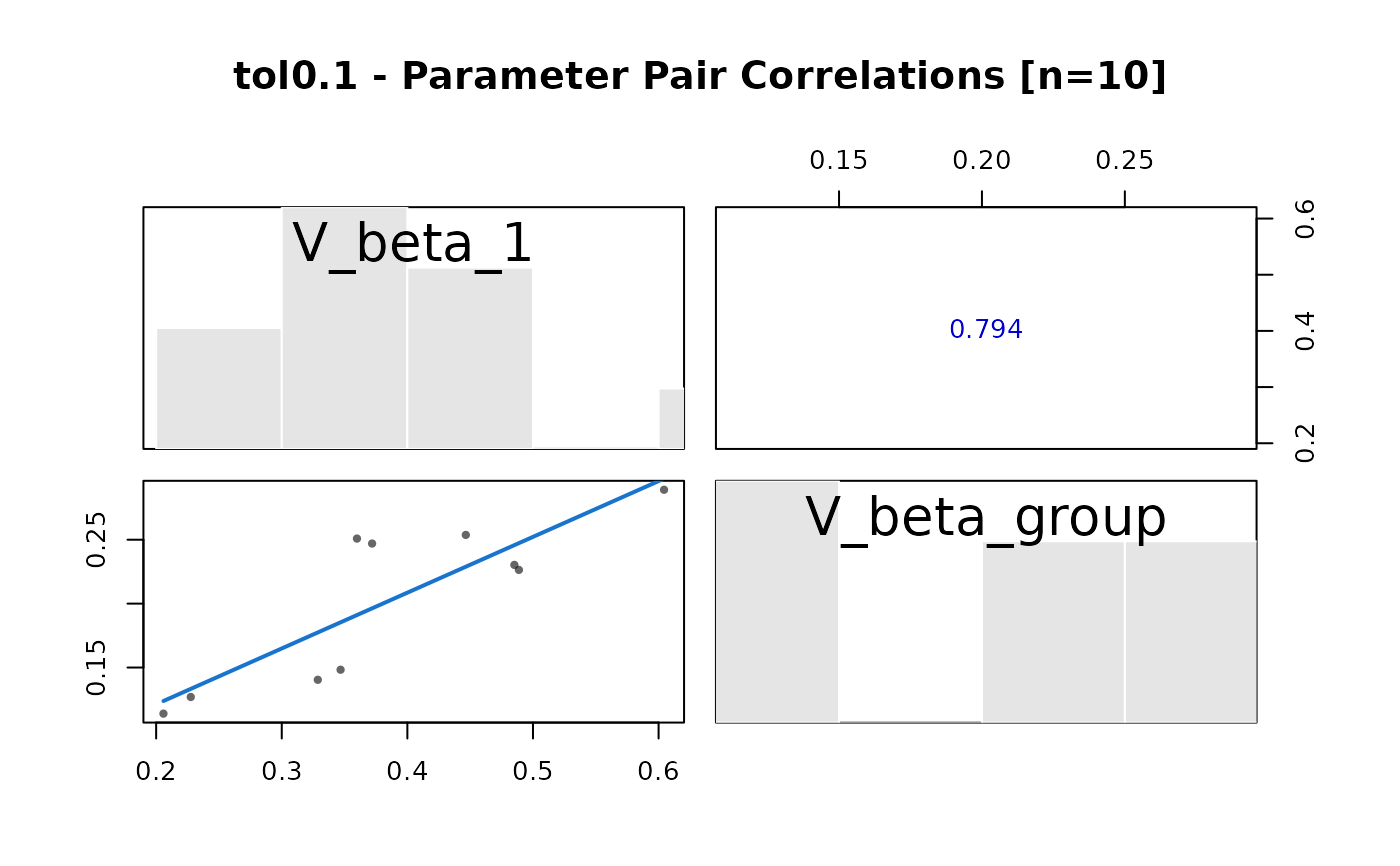
plot_cv_pair_correlation.RdCreate a matrix of pairwise plots for cross-validation parameter estimates, including scatter plots with fitted trends, rank correlations, and marginal distributions.
Usage
plot_cv_pair_correlation(data, ...)

# S3 method for class 'cv4abc'
plot_cv_pair_correlation(data, ...)Examples
# Load CV output from saved file
cv_file <- system.file(
  "extdata", "rdm_minimal", "abc", "cv", "neuralnet.rds",
  package = "eam"
)
abc_neuralnet_cv <- readRDS(cv_file)

# Plot parameter pair correlations
plot_cv_pair_correlation(abc_neuralnet_cv)