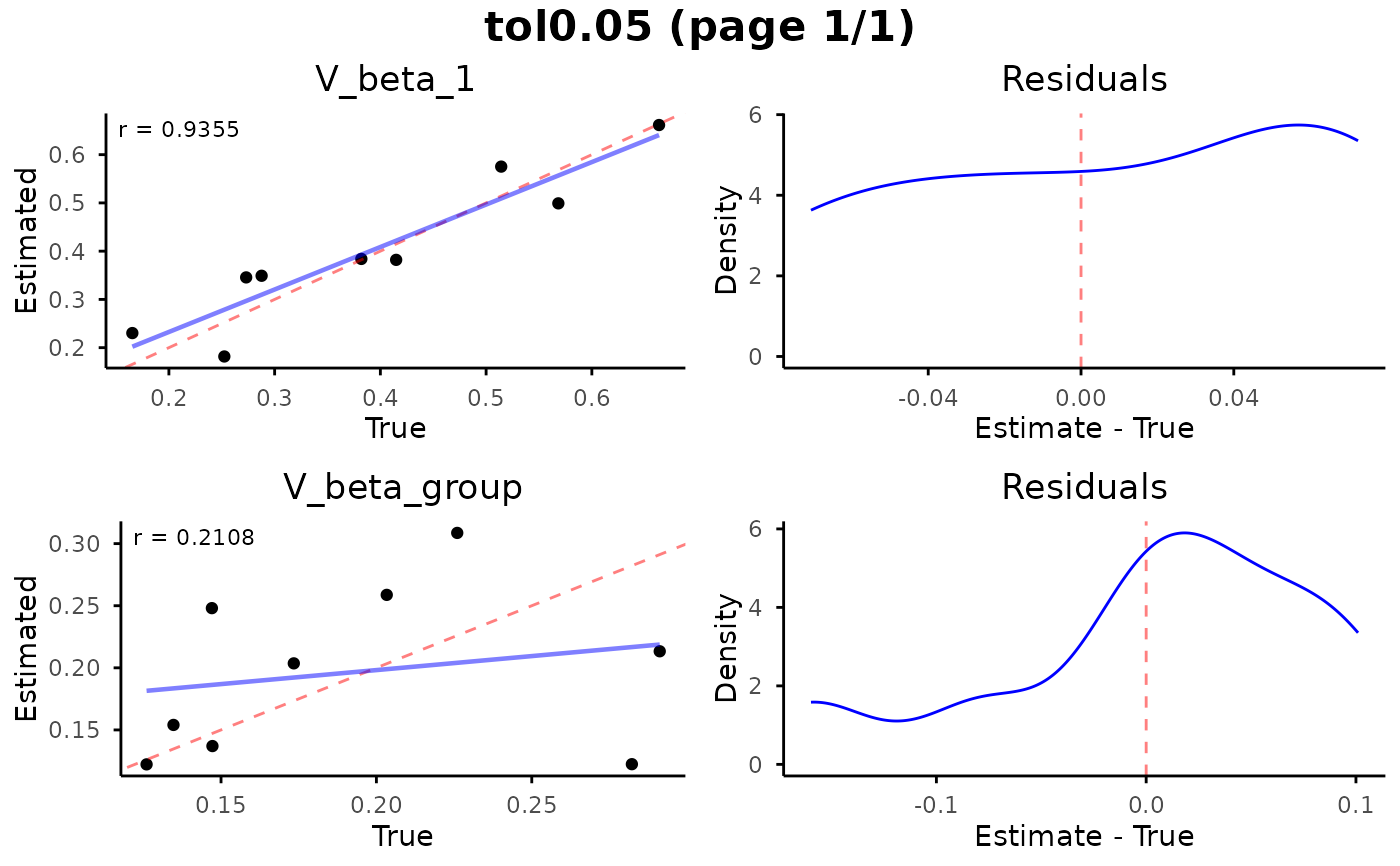
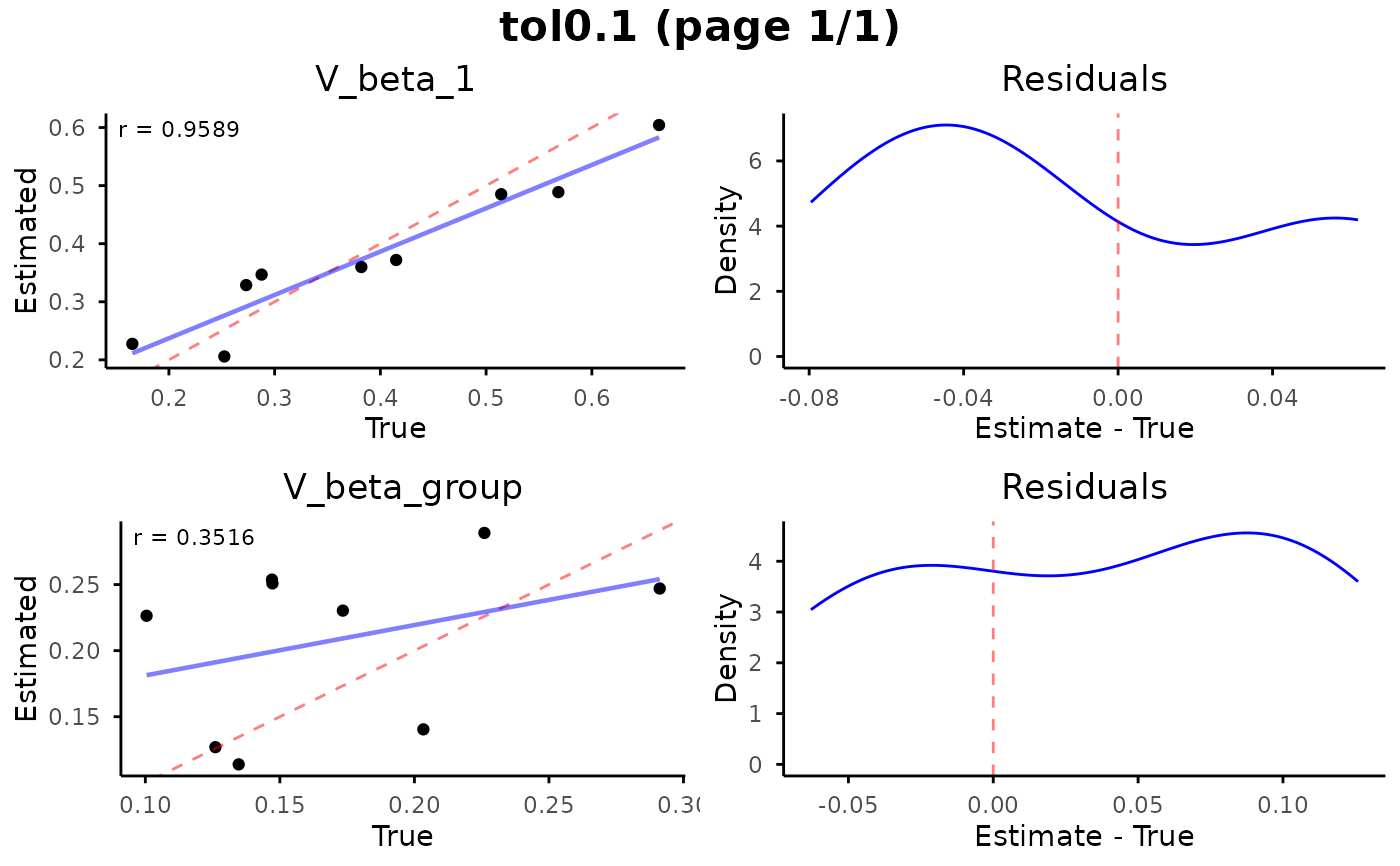
Visualize parameter recovery from cross-validation results, showing estimated vs. true parameter values and residual distributions for each parameter.
Usage
plot_cv_recovery(data, ...)

# S3 method for class 'cv4abc'
plot_cv_recovery(data, ...)

# S3 method for class 'eam_abi_assess'
plot_cv_recovery(data, ...)

# S3 method for class 'eam_abi_posterior_samples'
plot_cv_recovery(data, trained_estimator = NULL, theta = NULL, ...)
Arguments
- data
An
eam_abi_posterior_samplesobject fromabi_sample_posteriorcontaining posterior samples with columnsdataset_idand parameter columns. The median of each parameter for each dataset is used as the point estimate for recovery assessment.- ...
Additional arguments:
- n_rows
Integer; number of rows in the plot grid (default: 3)
- n_cols
Integer; number of columns in the plot grid, multiplied by 2 for paired plots (default: 1)
- method
Character; smoothing method for
geom_smooth(default: "lm")- formula
Formula; used in
geom_smooth(default: y ~ x)- resid_tol
Numeric; quantile threshold for filtering residuals by absolute value. If specified, only observations with residuals below this quantile are plotted (default: NULL, no filtering)
- interactive
Logical; whether to pause between pages and wait for user input (default: FALSE)
- trained_estimator
Optional. A trained estimator object returned by
abi_train. If provided, the true parameter values are extracted fromtrained_estimator$abi_input$theta_test. Eithertrained_estimatororthetamust be provided, but not both.- theta
Optional. A matrix of true parameter values with parameters as rows and datasets as columns. Column count must match the number of unique
dataset_idvalues indata. Eithertrained_estimatororthetamust be provided, but not both.
See also
plot_cv_recovery.cv4abc, plot_cv_recovery.eam_abi_assess,
plot_cv_recovery.eam_abi_posterior_samples
Examples
# Load CV output from saved file
cv_file <- system.file(
  "extdata", "rdm_minimal", "abc", "cv", "neuralnet.rds",
  package = "eam"
)
abc_neuralnet_cv <- readRDS(cv_file)

# Plot parameter recovery
plot_cv_recovery(
  abc_neuralnet_cv,
  n_rows = 2,
  n_cols = 1,
  resid_tol = 0.99
)


if (FALSE) { # \dontrun{
# Train a posterior estimator
trained_estimator <- abi_train(
  estimator = posterior_estimator,
  abi_input = abi_input,
  epochs = 50
)

# Sample from posterior using test data (default)
posterior_samples <- abi_sample_posterior(
  trained_estimator = trained_estimator,
  N = 1000
)

# Plot recovery using trained_estimator to get true values
plot_cv_recovery(
  posterior_samples,
  trained_estimator = trained_estimator
)

# Alternatively, provide true parameter values directly
plot_cv_recovery(
  posterior_samples,
  theta = abi_input$theta_test
)
} # }
if (FALSE) { # \dontrun{
# Train a posterior estimator
trained_estimator <- abi_train(
estimator = posterior_estimator,
abi_input = abi_input,
epochs = 50
)
# Sample from posterior using test data (default)
posterior_samples <- abi_sample_posterior(
trained_estimator = trained_estimator,
N = 1000
)
# Plot recovery using trained_estimator to get true values
plot_cv_recovery(
posterior_samples,
trained_estimator = trained_estimator
)
# Alternatively, provide true parameter values directly
plot_cv_recovery(
posterior_samples,
theta = abi_input$theta_test
)
} # }