Plot parameter posterior distributions
Source:R/plot_posterior_parameters.R
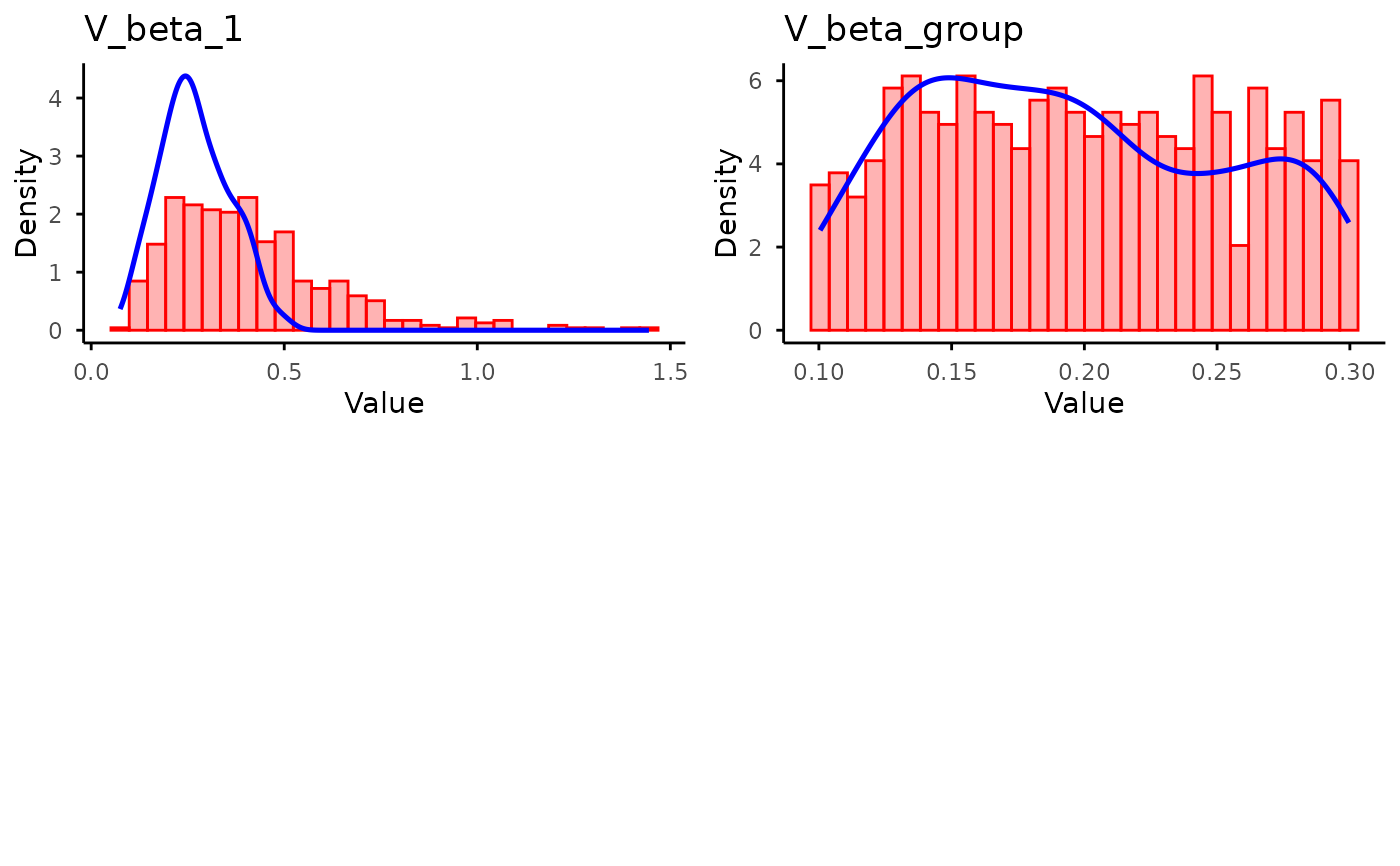
plot_posterior_parameters.RdPlotting posterior distributions (and optionally prior distributions) from ABC results.
Usage
plot_posterior_parameters(data, ...)

# S3 method for class 'abc'
plot_posterior_parameters(data, abc_input = NULL, ...)
Arguments
- data
An
abcobject containing posterior samples inadj.valuesorunadj.values.- ...
Additional arguments:
- n_rows
Integer; number of rows in the plot grid (default: 2)
- n_cols
Integer; number of columns in the plot grid (default: 2)
- interactive
Logical; whether to pause between pages and wait for input
- abc_input
Optional abc_input object containing prior samples for comparison.
Examples
# Load ABC output from saved file
abc_file <- system.file(
  "extdata", "rdm_minimal", "abc", "abc_rejection_model.rds",
  package = "eam"
)
abc_rejection_model <- readRDS(abc_file)

# Load ABC input for prior comparison
abc_input_file <- system.file(
  "extdata", "rdm_minimal", "abc", "abc_input.rds",
  package = "eam"
)
abc_input <- readRDS(abc_input_file)

# Plot posterior distributions with prior comparison
plot_posterior_parameters(abc_rejection_model, abc_input)