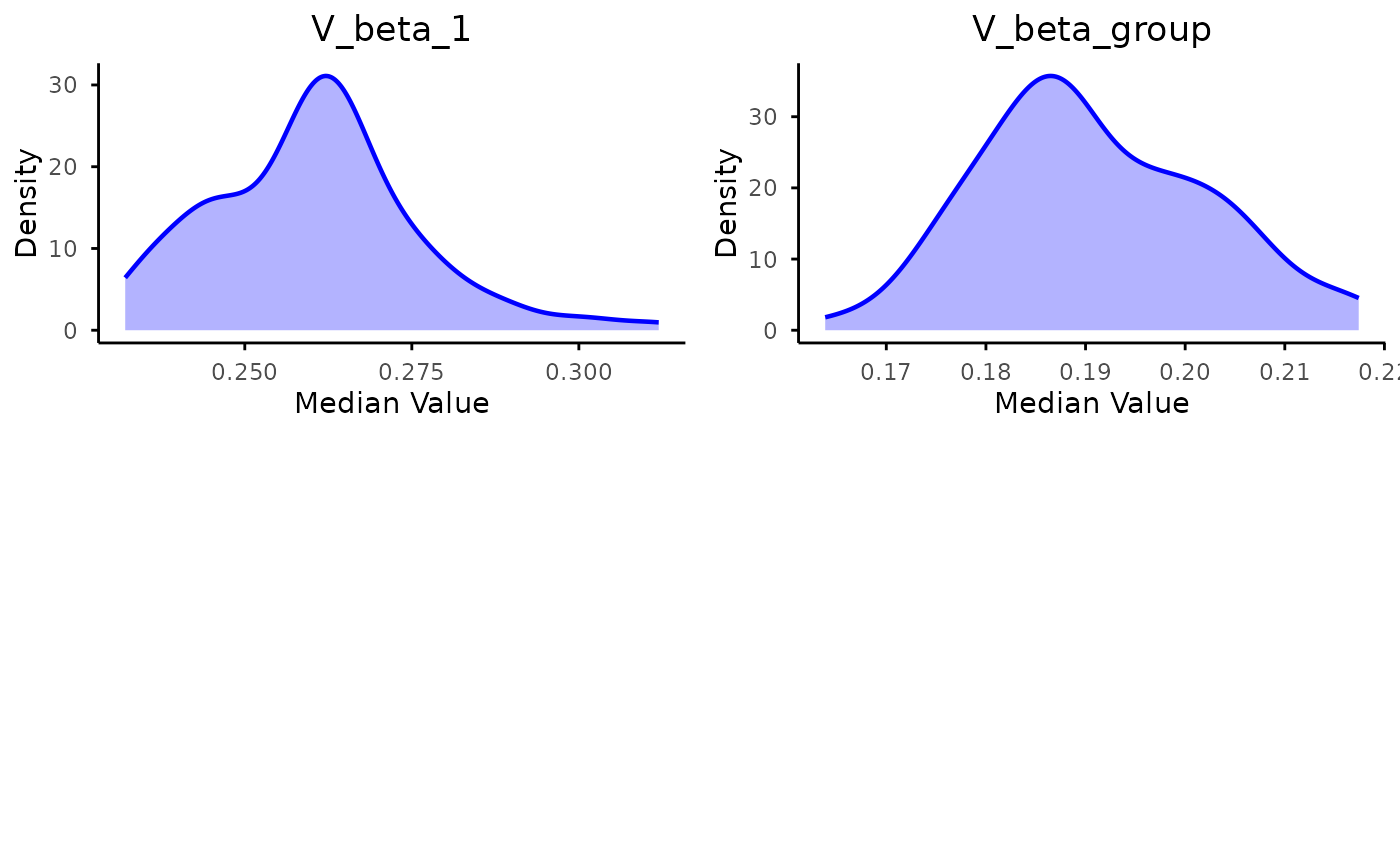
Plot density distributions of parameter medians across resample iterations.
Value
No return value, called for side effects (plotting). Creates density plots displayed in the graphics device.
Examples
# Load ABC input data from example simulation
abc_input <- readRDS(
  system.file("extdata", "rdm_minimal", "abc", "abc_input.rds", package = "eam")
)

# Perform ABC resampling
results <- abc_resample(
  target = abc_input$target,
  param = abc_input$param,
  sumstat = abc_input$sumstat,
  n_iterations = 100,
  n_samples = 100,
  tol = 0.5,
  method = "rejection"
)

# plot the resample medians for each parameter
plot_resample_medians(results)